Dashboard
The Dashboard displays an overview of your store's security metrics and trends.
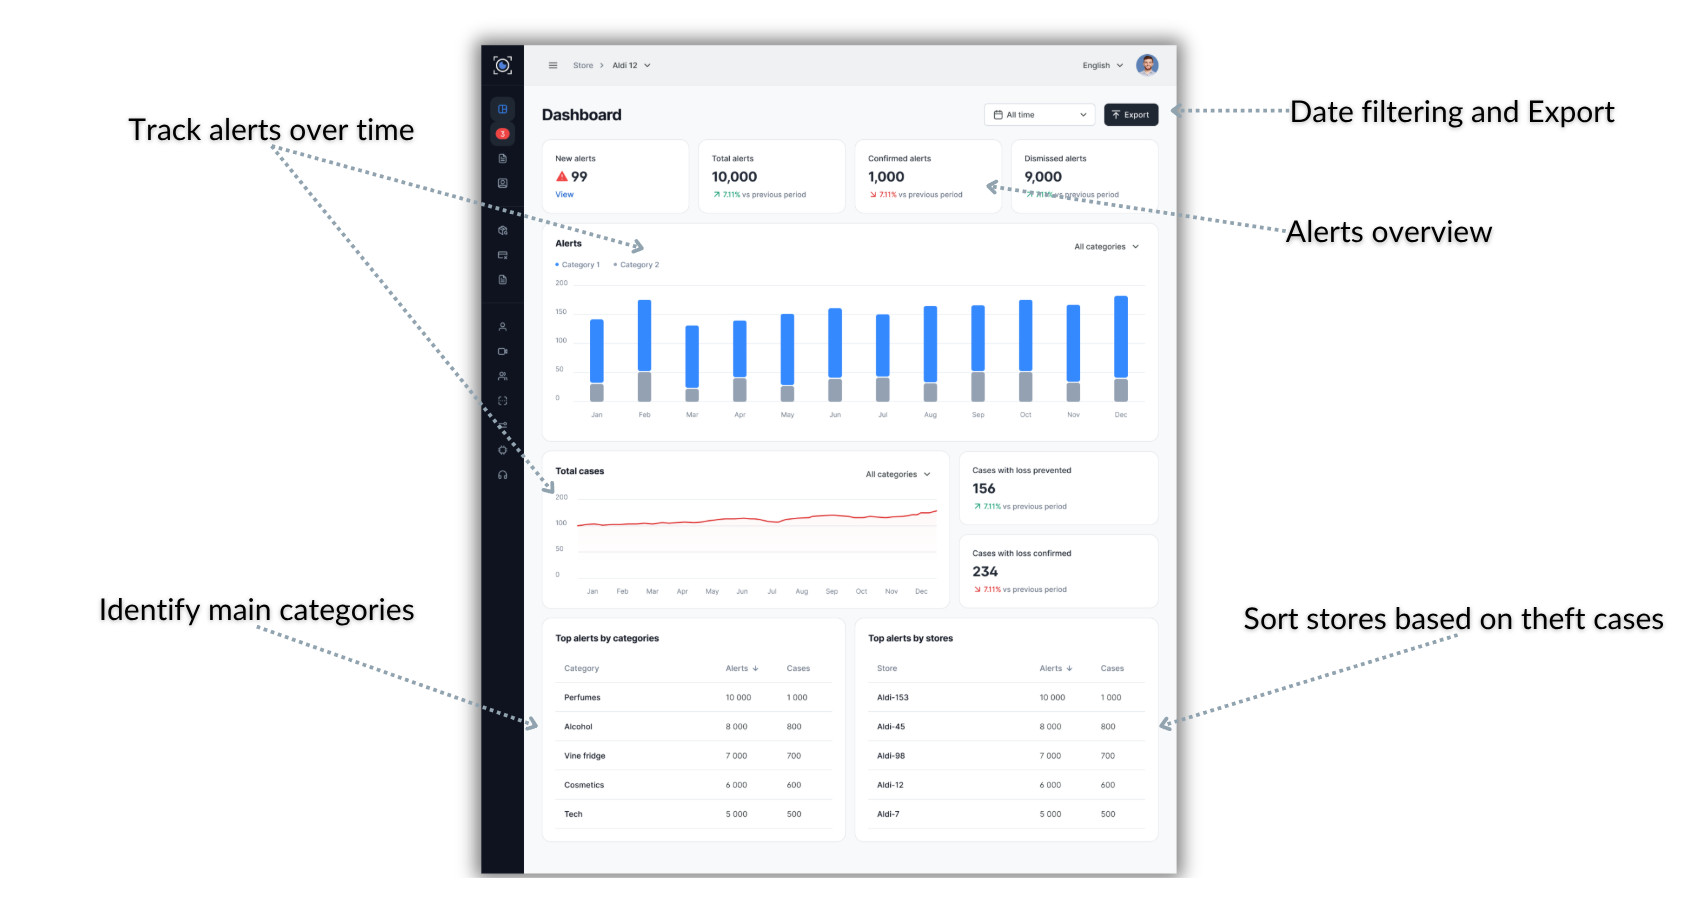
Dashboard Overview
The dashboard is organized into several key sections that provide different insights into your store's security performance:
- Alert summary cards showing key metrics at a glance
- Time-series charts displaying trends over your selected period
- Case management metrics showing investigation outcomes
- Interactive visualizations for deeper analysis
Key Metrics Cards
At the top of the dashboard, you'll find summary cards displaying your most important metrics:
New Alerts The count of alerts that have been generated but not yet reviewed or acted upon.
Total Alerts The complete count of all alerts generated during the selected time period.
Confirmed Alerts Alerts that have been reviewed and confirmed as legitimate security concerns.
Dismissed Alerts Alerts that were reviewed and determined to be false positives or non-actionable events.
Each card shows the current count and may include a trend indicator showing whether the metric is increasing or decreasing compared to the previous period.
Date Filtering
Filter dashboard data by date using the time filter selector in the top-right corner. This allows you to view metrics for different time periods:
Predefined time ranges:
- Today: Current day's data
- Yesterday: Previous day's activity
- Last 7 days: Rolling weekly view
- Last 30 days: Monthly overview
- Last 90 days: Quarterly trends
Custom date range: Select specific start and end dates for precise analysis of any time period.
All dashboard metrics and visualizations update automatically when you change the time filter.
Alerts Over Time Chart
The time-series bar chart shows how alerts have changed over your selected period. Hover over any bar to see detailed alert counts for that specific time period.
Cases Section
The cases section provides metrics on escalated incidents and their outcomes:
Total Cases The complete count of alerts that were escalated to cases for investigation during the selected period.
Loss Prevented Cases where intervention successfully prevented theft from occurring.
Loss Confirmed Cases where theft was completed and loss was documented.
Mobile Dashboard
The dashboard is fully responsive and accessible on mobile devices, allowing you to:
- Monitor security metrics from anywhere
- Receive real-time updates on critical metrics
- Access dashboard insights while on the floor
- Make informed decisions without being at a desktop